With metrics in place and an understanding of what is normal, you can create alerts to notify you when something appears wrong. With my personal metrics, if my heart rate suddenly goes to 200 bpm, that is not normal for me and I would want to know. Similarly, if the number of tags loaded is less than 60,000, instead of the normal number of around 63,000, that is not normal for the skill service. If 90% of responses to requests are taking over 1 second, that is also not normal, and it does not quickly resolve itself; it is a problem that needs investigation. This is what alerts are for.
Create the metric for an alert
For example, you could create an alert that triggers when the number of tags loaded is less than 60,000, as the skill service would be working, but since the number of tags is normally around 63,000, it would indicate a problem. The log message looks like this:
“loaded 63653 tags”
Create a notification channel for alerts
Before you can create an alert, you need a channel to be notified on. Google Cloud supports many channel types, but in this case, you will be creating a channel for notification by email. Again, the configuration is defined in YAML and then applied with gcloud. In the provided example code, there is a file templates/email_notification_channel.yaml.template. This contains a placeholder for an email address.
This will create the policy. Now if the number of tags loaded is ever below 60,000, you will receive a notification at the email you provided. You could test an alert by replacing the tags.csv file the skill service uses with one with less than 60,000 tags.
When the skill service is next loaded, the alert will be triggered, raise an incident, and send an email that will look like Figure 13-2. It also contains a link to the incident on Google Cloud and a description provided in the configuration to explain the alert and provide troubleshooting tips.
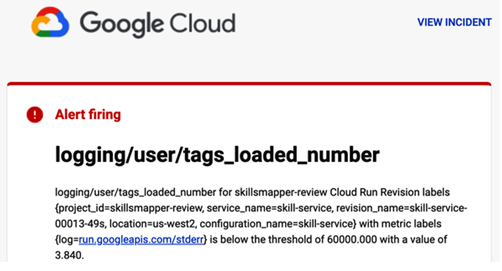
Figure 13-2. Alert email
In this case, the next time the tag updater runs on its weekly schedule, the tags.csv file will be updated. When the skill service next starts, it will load over 60,000 tags again, and the incident will be resolved.
User-Defined Metrics and Tracing
Rather than generating metrics by scraping logs, you can also create a custom metric from the application. Google provides a client library for many languages that you can use to create metrics from your application: OpenTelemetry.
OpenTelemetry is a set of open source tools for collecting telemetry data from your application and sending it to a monitoring system. At the time of writing, it is a CNCF incubating project and was formed by merging two earlier projects: OpenTracing for tracing and OpenCensus for metrics.
Once you use a solution like OpenTelemetry, you are treating traces, metrics, and logs as first-class citizens and designing them as part of your application rather than retrospectively by an operations team. This is a very cloud native approach and fits in well with SRE practices. As developers are thinking about the data, they will need to resolve problems, debug issues, and be able to design better applications.
As OpenTelemetry is a CNCF project, it does not lock you into Google Cloud. OpenTelemetry is supported by all the major cloud providers and many other products, so the work you do to instrument your application will be portable across providers. It supports many languages and frameworks, so you can use it with your existing applications.
At the moment, however, it is still in beta, and the documentation is not complete. The following sections are based on my experience of using it with the skill service. By the time you read this book, the official Google Cloud documentation is likely to have improved.