Tracing
The skill service receives a request, performs a lookup, and returns the results. From the outside, this is the latency of a single request, but internally it is made up of several steps. You can use tracing to see the latency of each step and to understand where the time is spent.
A trace describes how the system responds to a request. A trace is made up of spans, with a span representing a step to responding to the request. These concepts were first proposed in a paper on Dapper, Google’s internal distributed tracing system. By adding trace and span IDs to log messages, Google Cloud Trace and Google Cloud Logging will then be able to interpret the traces and display them in a dashboard. Traces are also useful for requests that span multiple services, as you can see the latency of each service as well as the individual step.
In the skill service, the trace will be at the request level where the prefix is submitted in the HTTP GET request, and the result will be returned.
While Google supplied a client library for tracing, it is now deprecated, and it is recommended to use OpenTelemetry instead.
Adding Trace and Span IDs to Logs
By default, all requests that are made to a Cloud Run HTTP endpoint already have tracing enabled, so you should already see traces in the Google Cloud Trace console.
For example, Figure 13-3 is a trace to the skill service. You can see there is a single span for the request, as no span has been specified. The overall request takes 4.6 seconds, but the actual processing time in the skill service is only 1.6 seconds. Here, the latency is due to the time taken to start the container and load the tags from Google Cloud Storage, as the skill service has not been used for a while and needs to cold start.
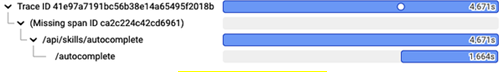
Figure 13-3. Google Cloud Trace
A trace ID is set in the X-Cloud-Trace-Context header for each request to enable tracking.
However, the default trace could be more useful, as currently it only shows the request to the skill service and not the internal steps. The skill service is already using the OpenTelemetry client library to generate traces. However, the service account needs to be granted the cloudtrace.agent role to be able to write traces to Google Cloud Trace.
You can now see the traces in the Google Cloud Trace console in Figure 13-4. This gives an example of how traces can drill down into the code to show you where the time is spent. However, nearly all the time spent on the autocomplete function is in the search span, and this makes sense. You can see that the surrounding code that is not in the search span is not taking much time.
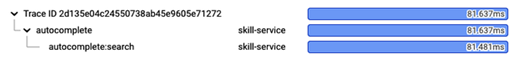
Figure 13-4. Google Cloud Trace with spans
The beauty of traces is that you can keep adding spans to drill down into the code to see where the time is spent. However, there is a lot more in the OpenTelemetry client documentation about how to build on this.